Overview & quick start
VeloBenchmark is a single-binary LLM benchmarking and live-stats console. Point it at any OpenAI-compatible endpoint and it gives you the whole loop: chat with a model and watch accurate decode-speed and latency instruments in real time → build test suites → run them single-stream or under concurrent load → read the report, compare sessions, export PNG/PDF or copy it as plain text. It can also sit as a live telemetry dashboard in front of a serving engine's OpenTelemetry stream.
The deliverable is one binary: the entire web UI is embedded and served by the Rust backend. At runtime it only creates the data files it needs — nothing else is required on the host.
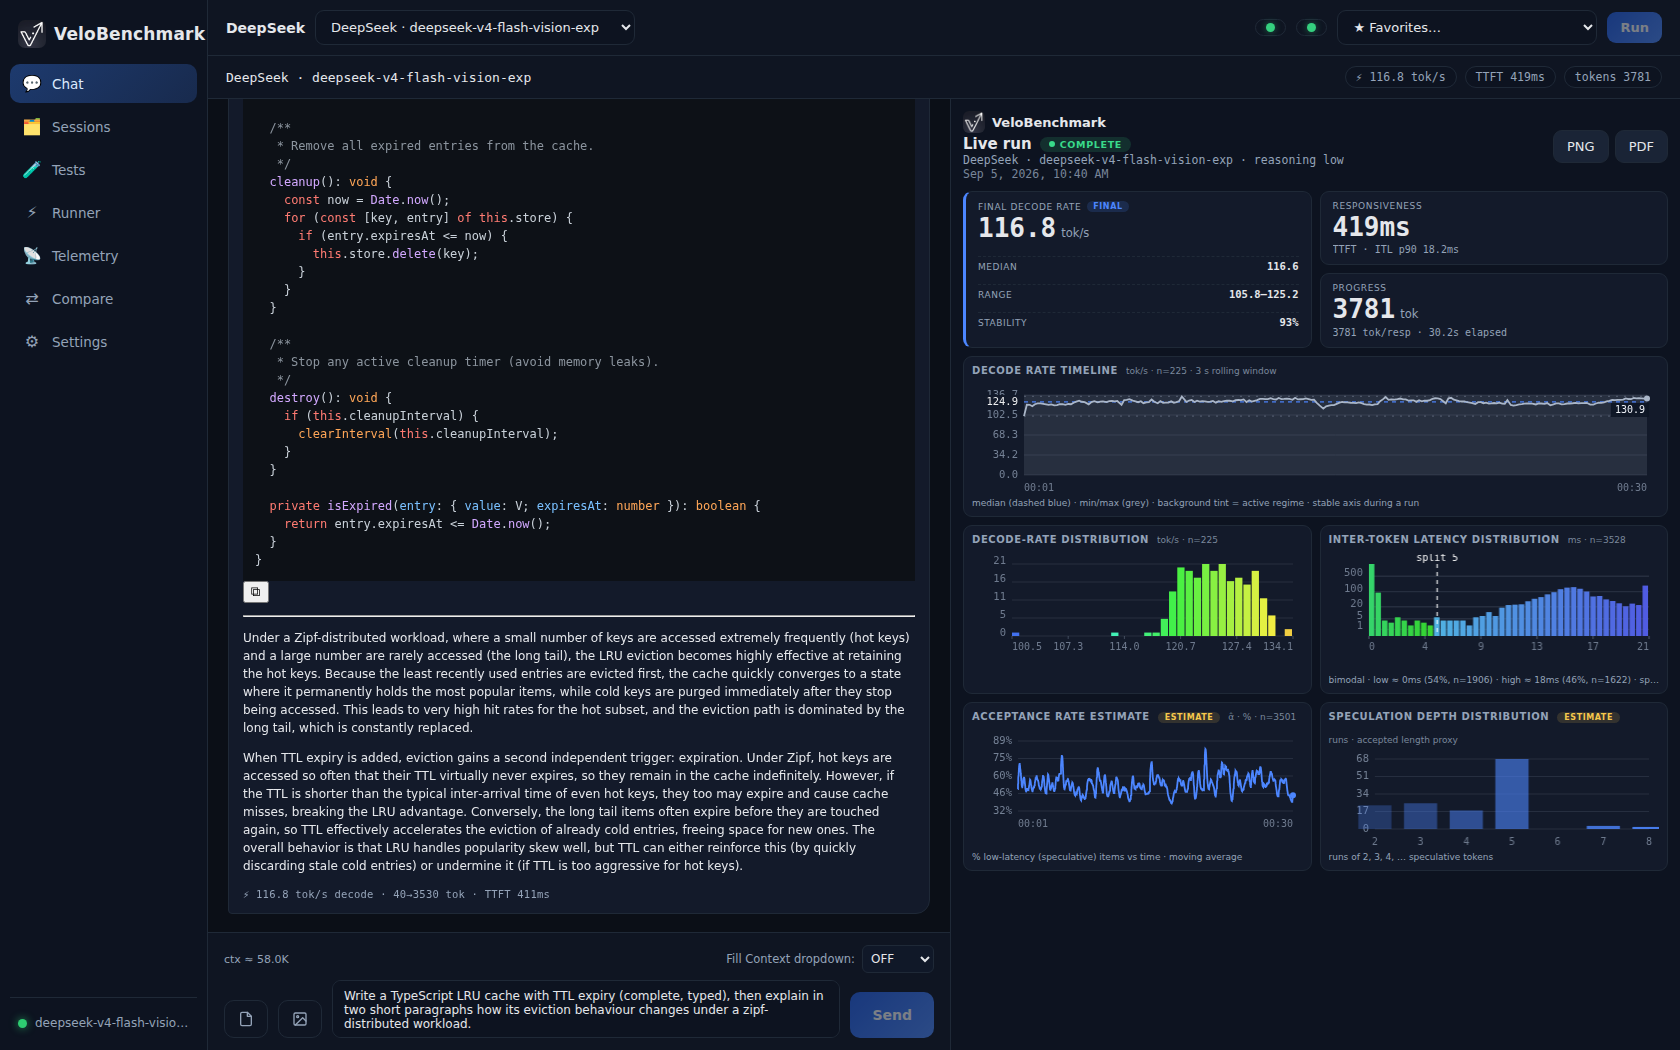
The chat console after a completed turn: streaming transcript on the left, the live stats deck on the right — decode timeline, distributions, acceptance-rate estimate.
What it does
- Measures what actually happens, per token. Decode rates are computed from real
streaming token timing; when the provider reports
usage, the final numbers snap to the authoritative token counts. Live min / median / max, TTFT, inter-token latency, prefill behaviour — all server-side, all exportable. Timings are stamped as tokens arrive from the engine, so a slow browser tab delays what you see, never what is measured. - Shows output-type effects. Every answer is tagged by regime (prose, code, math, json, reasoning, …) as it streams; the charts split by regime so you can see a model slow down on math and speed up on code within one answer.
- Turns scenarios into repeatable suites. A visual test builder with five step types — sections, prompts, exact context fills, fixed-shape bench requests, and vision steps over an embedded image library.
- Scales the same suite to concurrency. N workers walk a test with a step barrier, one shared report, per-worker timelines and their sum.
- Comparisons. Line up any sessions — same prompts across models, before/after a server change, single vs concurrent — in one view.
Install
One line (Linux & macOS, x86_64 + arm64):
curl -fsSL https://raw.githubusercontent.com/sf-stav/VeloBench/main/install.sh | sh
The installer downloads a prebuilt binary from GitHub Releases when one exists for
your platform, and otherwise builds from source into ~/.velobenchmark (Rust, Node and
protoc installed into your home directory — no root required). It starts the server,
health-checks it, and prints the URL to open.
From source instead:
npm --prefix frontend install
bash scripts/build-frontend.sh
cargo build --release
./target/release/velobench --host 0.0.0.0 --port 13843
Full details, service setup and the release pipeline: Building & installing.
Quick start
- Start the server and open
http://localhost:13843. - Settings → add a provider — an OpenAI-compatible base URL plus key
(llama.cpp
llama-server, vLLM, LM Studio, OpenRouter, cloud endpoints, …). Add a model: the list is fetched live from the provider's/v1/modelsevery time the dialog opens, then pick it in the top bar.

- Chat — send a prompt and watch the live stats: rolling tok/s, TTFT, the per-regime decode timeline and the histograms. Stop mid-generation and the partial turn still records its stats.
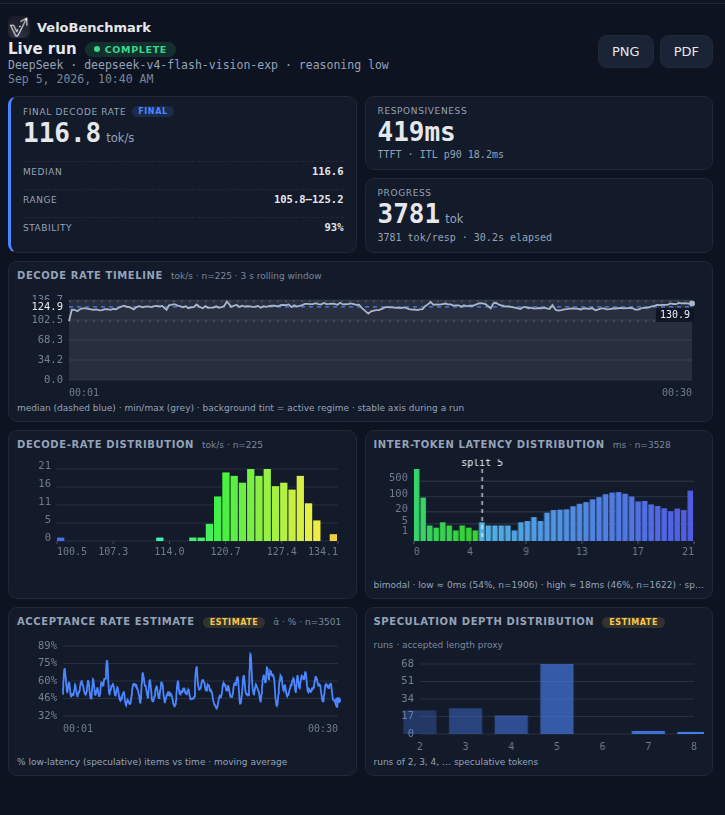
- Tests → Run a built-in suite. Try Regime switch · JavaScript ⇄ story to see decode speed swing between code and prose, or Vision · all test images on a vision model. Build your own with the five step types:

- Sessions → open the run and read the report; export it as PNG or PDF — or open the Text tab and Copy the whole report as plain text.

- Runner — the same test with N workers behind a step barrier, one shared report with the workers + Σ decode timeline.

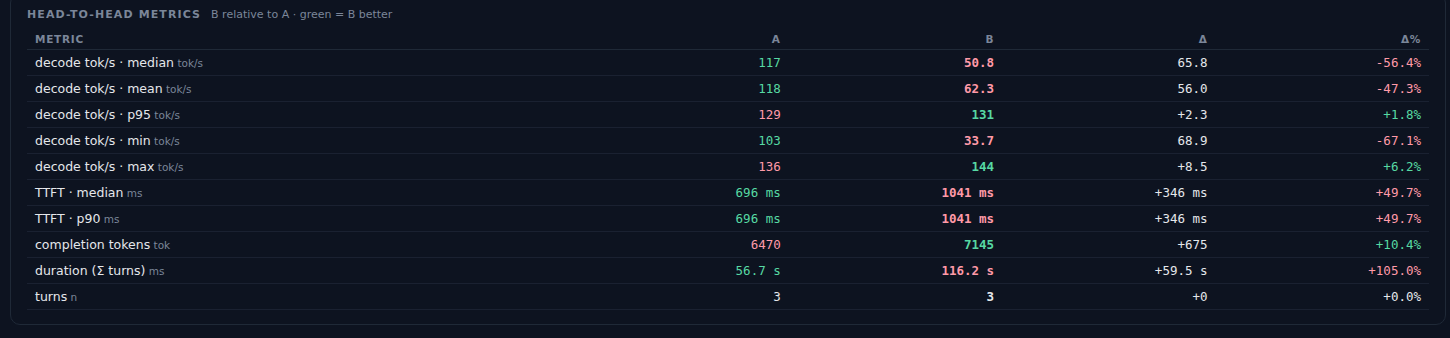
- Compare — line two sessions up and see exactly what changed, metric by metric.
Where to next
| User manual | Every screen, every report, building tests, the runner |
| Building & installing | Prerequisites, build, run, systemd, releases |
| Telemetry setup | The OTLP receiver and the engine's --otel-* flags |
| Metrics & methodology | What each number means and how it is computed |
| Known limitations | The honest edges |