Telemetry setup
VeloBenchmark can act as a live telemetry dashboard for a serving engine that emits OpenTelemetry. The engine POSTs OTLP/HTTP-JSON to VeloBenchmark's built-in receiver, and the Telemetry page turns that into per-stream live panels — streaming text, decode speed, latency breakdown — plus one-click recording into a normal session report.
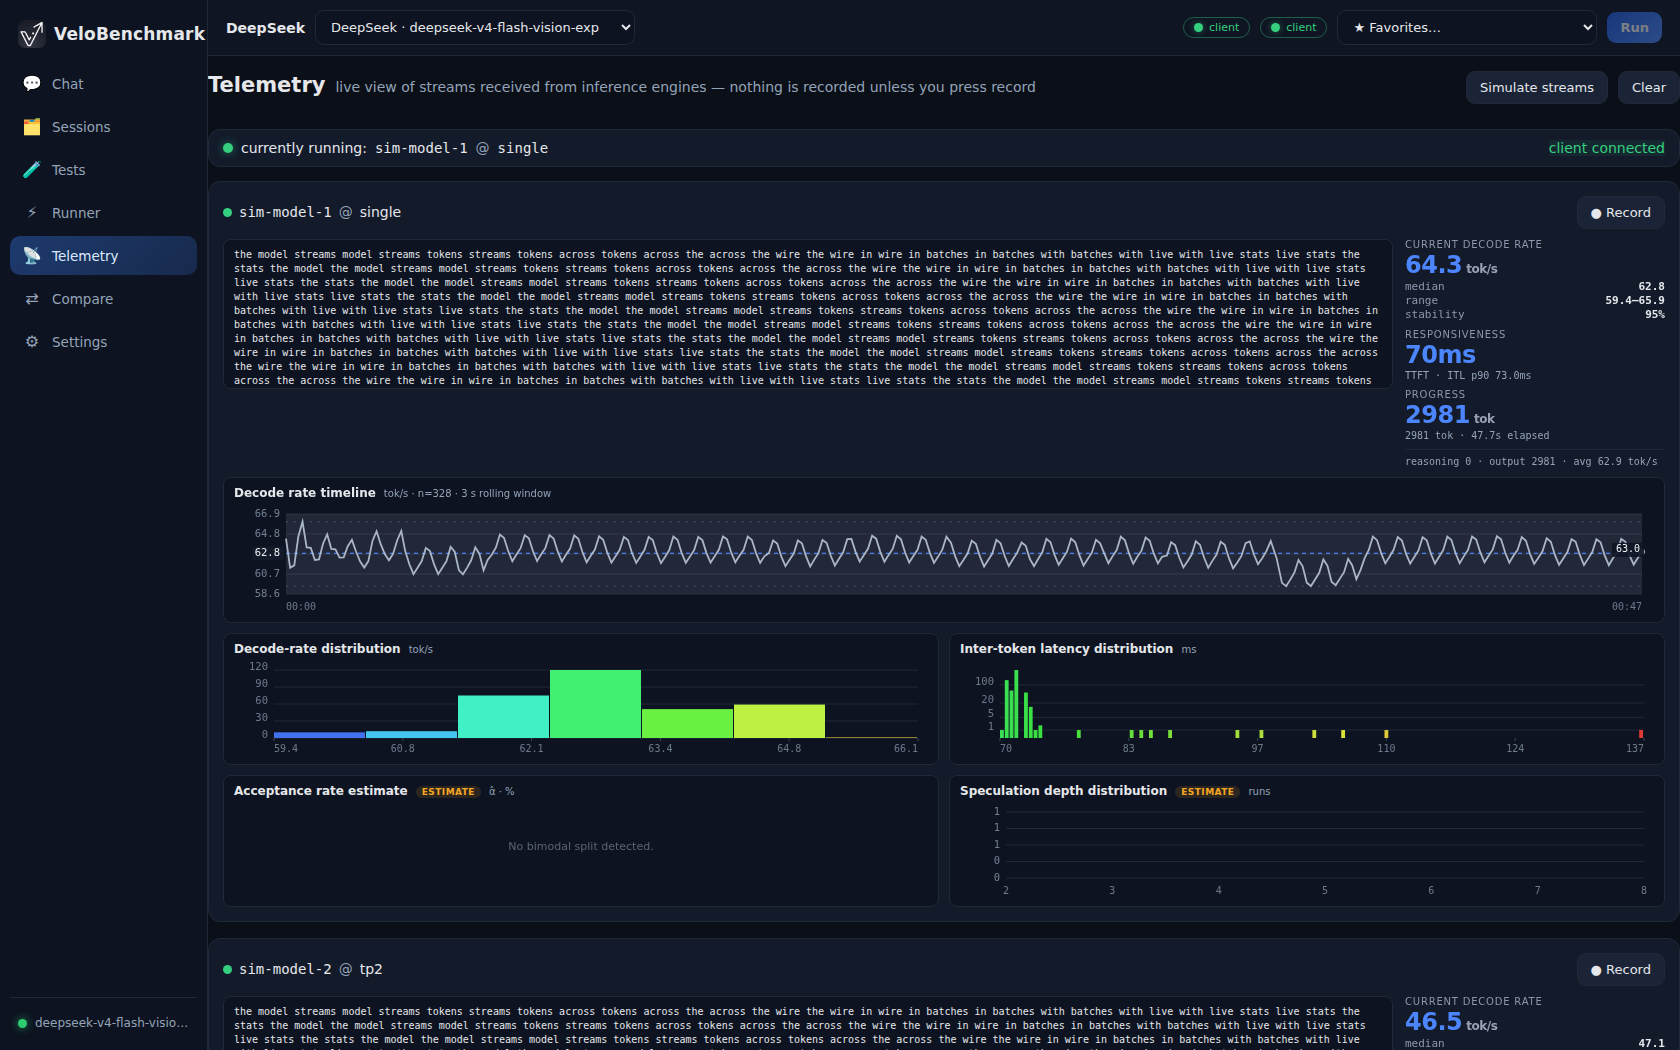
Demo: an engine's OTLP stream arriving as live per-stream panels, and recording one into a permanent session.
There are two sides:
- The receiver — VeloBenchmark itself (Settings → Telemetry).
- The emitter — your serving engine's
--otel-*flags, documented below.
1. The receiver (VeloBenchmark side)
Open Settings → Telemetry:
- Enabled — the on/off switch. When off, the listener does not exist.
- Host / Port — where the receiver listens. Default is the box's interfaces on port 9381. It accepts:
POST /v1/logs— generation telemetry (batched LogRecords),POST /v1/metrics— metrics (wired for Live Stats).- Max streams — panel cap for concurrent live streams.
- Chat lines — size of the rolling text window per panel (min 3).
- Recording caps — when you press Record on a live stream, the capture
is bounded by
record_max_secs(5–300 s) andrecord_max_tokens(500–20000): recording takes only the window from the button press onwards, and turns it into a normal session with the full report.
The receiver is plain HTTP on a trusted network — no TLS, no auth. Do not expose it to untrusted networks.
Everything shown on the Telemetry page is computed server-side and pushed to the browser over a WebSocket (~120 ms ticks): the same stats engine as the chat page, the same numbers, the same latency.
2. The emitter (serving engine side)
All of these are --server-mode flags of the engine, and they only matter
when the first one is present — that's the on/off switch.
--otel-endpoint <URL> — the master switch (no default = OFF)
Enables the emitter: the engine POSTs OTLP/HTTP-JSON to <URL>/v1/logs
(batched generation telemetry) and has <URL>/v1/metrics wired for Live
Stats. Point it at VeloBenchmark:
--otel-endpoint http://<velobench-host>:9381
(4318 is the OTLP/HTTP convention port and the engine's default if you omit the port — VeloBenchmark's receiver uses 9381, so spell it out.)
- Absent = OFF = zero cost. The whole emitter — ring, session registry,
sender task — doesn't exist; every hook in the serving path compiles down
to one skipped
if let. http://only — the engine's dependency-free HTTP client doesn't speak TLS. Anhttps://endpoint is refused at startup, before the model load — it will never boot pretending to stream.- The receiver being slow or down can never hurt decode. If the ring fills or a POST fails, rows are dropped (logged, throttled) and generation continues untouched.
--otel-batch-size <N> [512]
The maximum number of LogRecords packed into one
ExportLogsServiceRequest POST. The sender drains up to this many rows per
tick.
512 comfortably covers ~8 concurrent streams at ~50 tok/s within one 100 ms interval (~40 records); it only binds under heavy concurrency, where it caps each POST's size instead of letting requests grow unbounded.
Lower it (e.g. 64) if your receiver dislikes large bodies; raise it if you're pushing hundreds of streams and want fewer, bigger POSTs.
--otel-batch-interval-ms <MS> [100]
How often the one sender task wakes to drain the ring and POST a batch — the drain period. The sender is timer-polled: it sleeps, wakes, drains whatever accumulated, POSTs, sleeps. It is never woken per token.
This is the latency/volume trade-off knob: at 100 ms a token appears in your client at most ~100 ms after the SSE chunk did (plus POST time). 50 ms = snappier live view, ~2× the POST rate; 500 ms = very quiet wire, up to half a second of display lag.
Decode never waits on it — a tick that finds an empty ring POSTs nothing.
--otel-include-tokens <on|off> [on]
Controls per-token volume: whether each SSE completion chunk becomes a
stream_delta LogRecord.
- on — full fidelity:
stream_start→ onestream_deltaper SSE chunk (the exact chunk bytes as the body) →stream_end, plus periodicstatus. This is what makes the client's live view replay the generation, and what the same-info guarantee is about. - off — skeleton only:
stream_start/stream_end/statusrecords still flow (so sessions, lifecycle, and the model@topology line all still work), but the per-token path short-circuits at one branch — no delta records at all, near-zero telemetry traffic. Use it when you want session/liveness tracking without the feed.
--otel-model-id <ID> — override the model.id attribute
By default the engine auto-derives it from the serve config: the model card's
base_model: line (e.g. Qwen/Qwen3.8-27B — the same id /v1/models
reports), or --model-name if you set that. Pass this to stamp something
else — useful when your client's UI keys on its own catalog names, or when
two deployments serve the same weights under different names and you need to
tell the telemetry apart.
--otel-topology <T> — override the topology attribute
Auto-derives from --tp: absent → single, --tp 2 → tp2, --tp 4 →
tp4 (any world N → tpN). Override when you want a different label — e.g.
distinguishing two single-box servers (--otel-topology node-a) or a TP=2
pair you'd rather see labeled dgx-pair. It feeds the client's "currently
running: model @ topology" line (refreshed by the periodic status record
every 10 s).
Session identity — deliberately not a flag
There is no --otel-session-* flag — the session key comes per request
(X-Session-Id header, metadata.session_id, or automatic continuation
inference), because it is a property of a conversation, not of the server.
That is why one engine can feed many dashboards/sessions without restarting
anything.
Practical recipes
# Full-fidelity live view, default tuning
--otel-endpoint http://127.0.0.1:4318

# Snappier UI update
--otel-endpoint http://127.0.0.1:4318 --otel-batch-interval-ms 50

# Quieter wire via skeleton-only (session/liveness tracking, no token feed)
--otel-endpoint http://127.0.0.1:4318 --otel-include-tokens off

# Distinguish two servers on one dashboard
--server A: --otel-endpoint http://rx:4318 --otel-topology box-1
--server B: --otel-endpoint http://rx:4318 --otel-topology box-2

# Point an engine at VeloBenchmark's receiver
--otel-endpoint http://<velobench-host>:9381
Using the live view
With the engine running and the receiver enabled:
- Open Telemetry in VeloBenchmark.
- Start a generation on the engine (chat, benchmark client — anything).
- A panel appears per stream: the text feed, the stats deck (decode rate, responsiveness, progress, reasoning/output split) and the full chart set, updating ~10× per second.
- Press Record on a stream to freeze the rolling window into a permanent session — the report (analytics, export, comparison) then works on it like any locally-run session.