User manual
VeloBenchmark is a single-binary LLM live-stats benchmarking and chat console. This manual walks through every screen, how to create and run tests, and how to read the reports.
New here? Start with the Quick start at the bottom, then come back for the details.
Table of contents:
- Adding providers and models
- Chat — manual testing
- The live stats panel
- Tests — building suites
- Runner — concurrent load
- Sessions
- Session analytics — what each report shows
- Comparing sessions
- Telemetry
- Quick start
Adding providers and models
Everything lives in Settings (⚙ in the sidebar). Settings are stored
server-side in velobench_data/ — they survive browser changes and restarts.
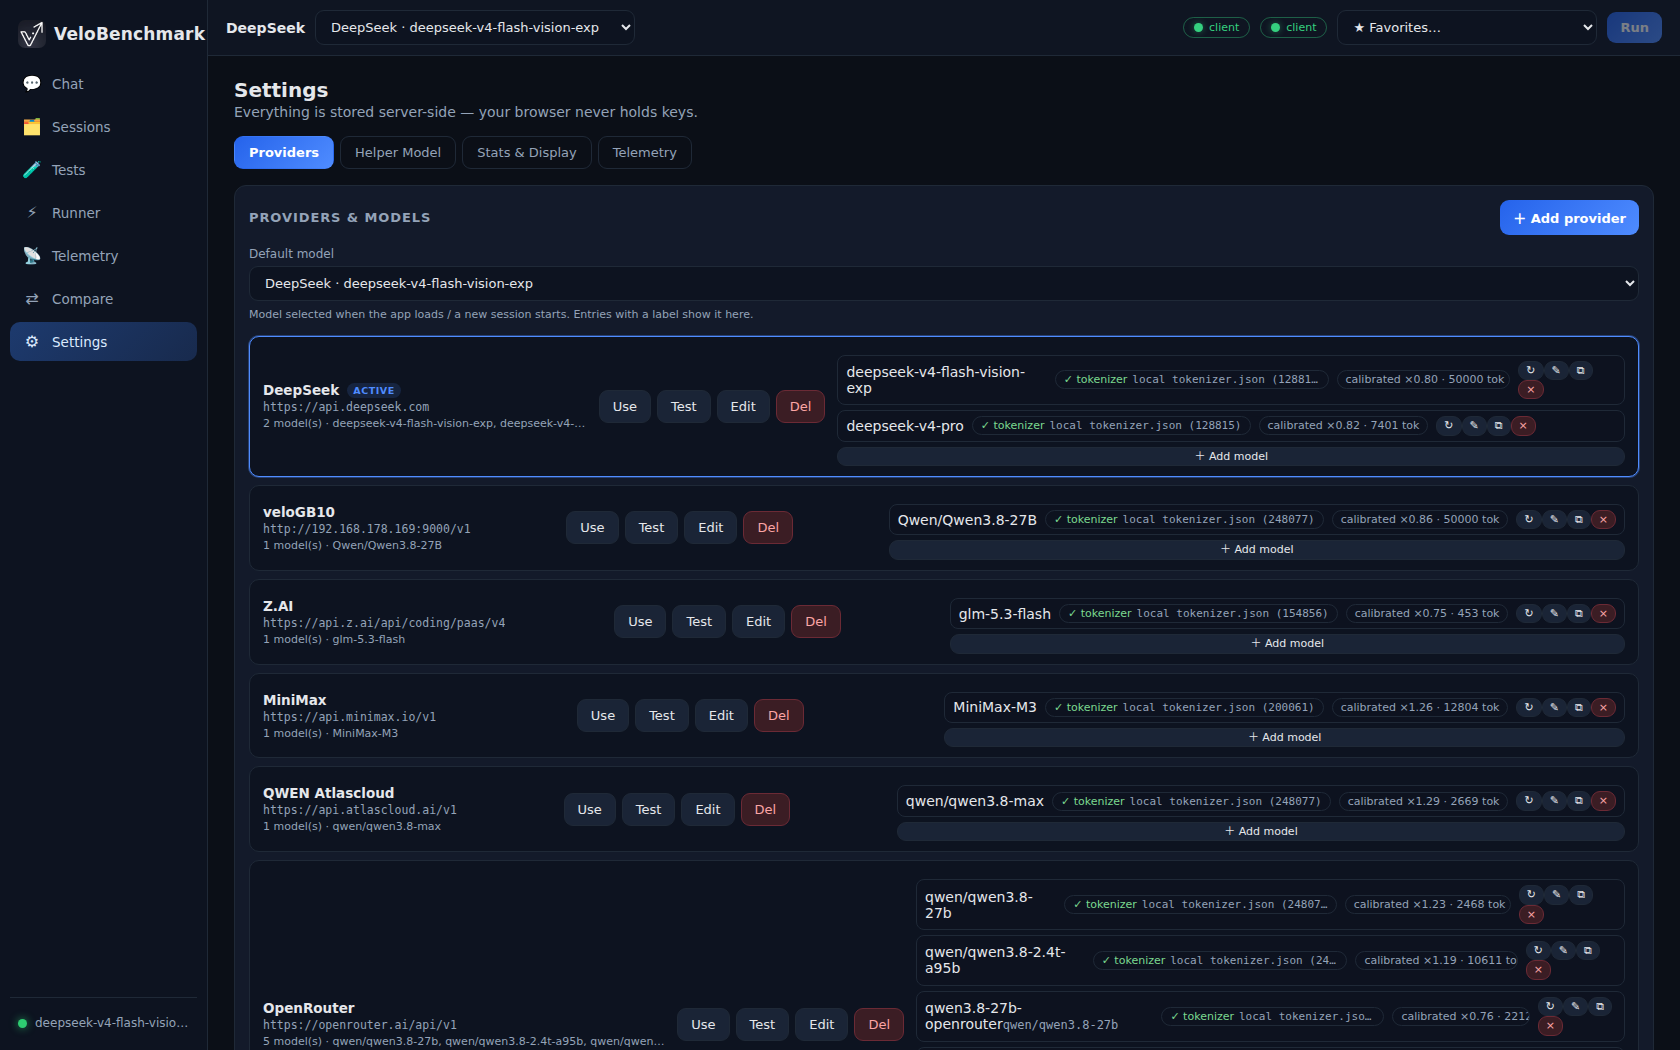
Settings → Providers: every provider card carries its models, tokenizer status and live-calibration ratio.

A provider card: base URL, model entries with tokenizer source and calibration, and the per-model actions (use / test / edit / duplicate / remove).
- Add a provider — an OpenAI-compatible base URL plus an API key. Any
server that speaks
/v1/chat/completionsworks (llama.cppllama-server, vLLM, LM Studio, OpenRouter, cloud endpoints, …). - Add a model — the model list is fetched live from the provider's
/v1/modelsevery time the dialog opens (never cached), so new models appear immediately. - Per-model configuration:
- Parameter overrides —
temperature,top_k,repetition_penalty,seed, … as key/value pairs. These are merged into every request the model serves. - Reasoning — a per-model reasoning toggle and effort level (off / low / medium / high / …). When reasoning is off, no effort is sent. - Tokenizer — optional path/URL to atokenizer.jsonfor exact token counting. Without it, VeloBenchmark probes the server's tokenizer; as a last resort it falls back to an estimated count (you can set a per-model live calibration ratio to bring live tok/s in line with the provider's authoritative usage numbers). - Helper model — a separate provider/URL/key/model used for background meta-analysis (e.g. output classification). Independent of your chat models.
- Model + provider switcher — the dropdown in the top bar switches the active config for the current session; the persisted default can be set in Settings.
Chat — manual testing
The Chat page (💬) is a full streaming chat console with a live measurement instruments attached.
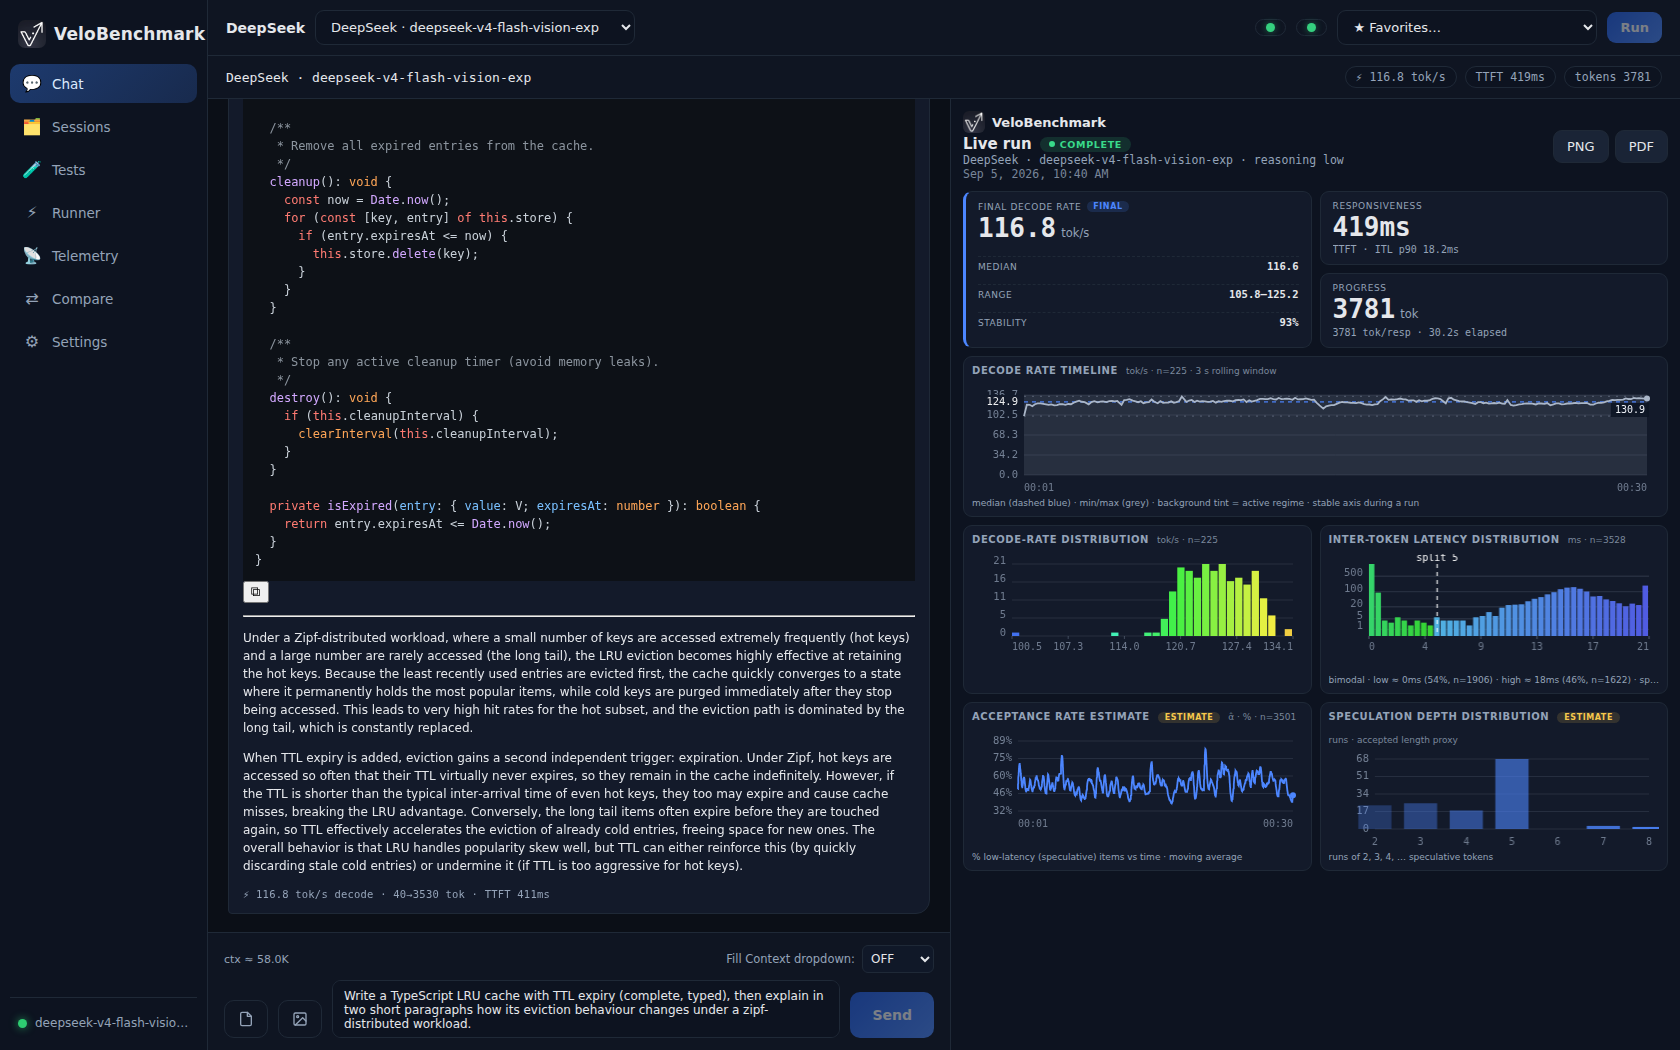
- Send any prompt; the answer streams in with server-side live stats.
- Stop mid-generation — the partial turn still records its stats.
- Attach images — click the attachment control (or paste) to add images to
a message; they are sent as OpenAI
image_urlparts. Vision-capable models describe them; the turn is measured like any other. - Fill Context — a selector next to the composer sends a lorem-ipsum prefill of a chosen size (K tokens = 1024 tokens) to measure TTFT / prefill speed at various context depths. The box is disabled while the fill streams and returns to OFF afterwards.
- Reasoning models — reasoning deltas are captured separately and shown (and measured) distinctly from answer content.
- New Chat starts a fresh VeloBenchmark session; each session keeps its own identity and report.

The composer: attachment and image controls, the prompt box, Send/Stop, and the
Fill Context selector with the running context estimate (ctx ≈ …K).
The live stats panel
While a turn streams (and once it finishes), the right-hand panel shows:
- Current decode rate — tok/s over a rolling window, plus the tokens generated so far.
- Responsiveness — time-to-first-token and elapsed generation time.
- Progress — output vs reasoning token split, averages, and the final
snap to the provider's authoritative
usagecounts when reported. - Decode-rate timeline — per token-group decode speed, tinted by the detected output regime (prose / code / math / json / reasoning / …).
- Split graphs per regime — when a model switches output type mid-answer (code → prose → math), each regime gets its own coloured segment, which exposes the minimum and maximum decode speeds.
- Histograms and prefill bars — distribution views for quality/regime analysis and prefill measurements.
- Export — the visible stats screen exports as PNG or PDF.
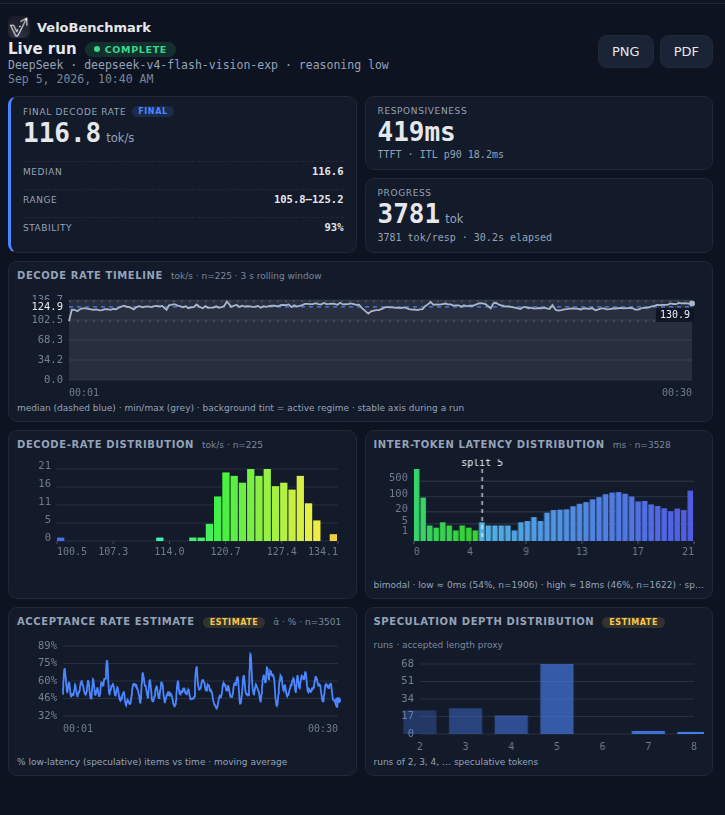
The stats deck after a completed turn: final decode rate with median/range/stability, responsiveness (TTFT and ITL p90), progress with the authoritative usage snap, the decode-rate timeline, and the decode-rate / inter-token-latency distributions.
Tests — building suites
The Tests page (🧪) lists built-in suites and your own tests.
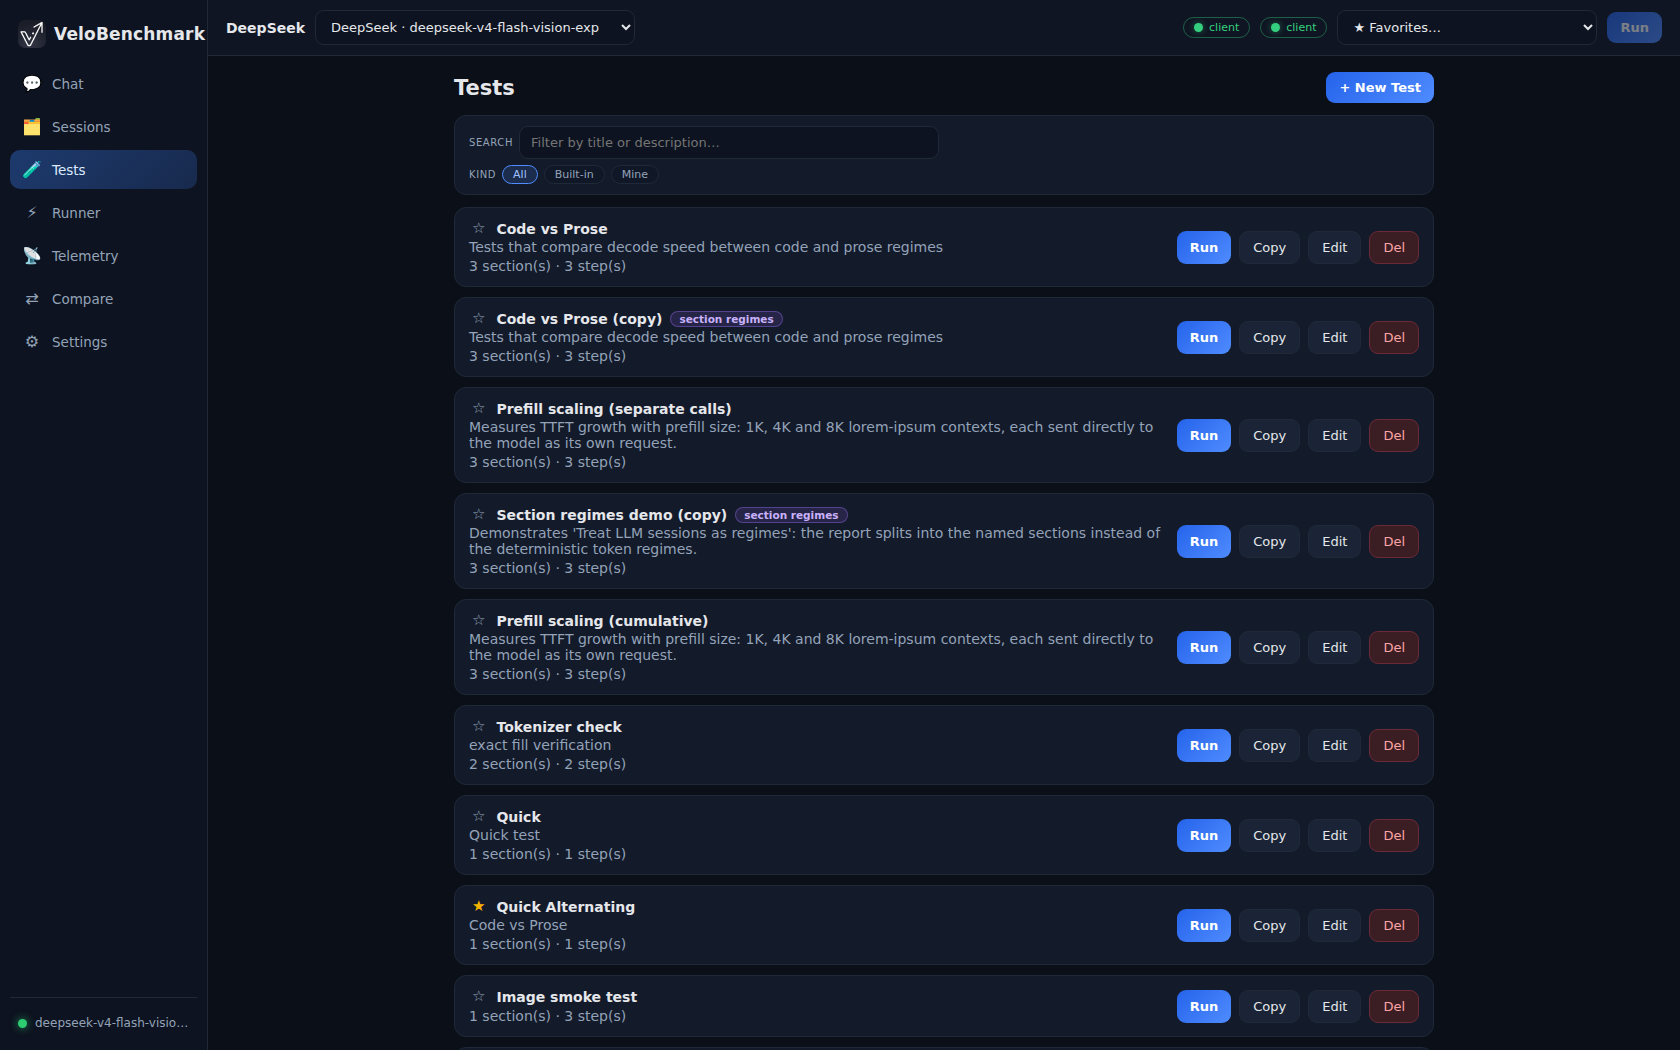
- Built-in suites cover: sanity & arithmetic, prefill scaling, section regimes, fixed-shape sweeps (pp/tg sweeps and a quick shape check), regime switching (JS⇄story, math⇄story), pure code, deep reasoning, creative prose, and a vision sweep across all embedded test images. Built-ins are view/run only and refresh on every server start — your favourite marks on them survive.
- Your tests are created with New test and edited in either:
- UI mode — add steps with the buttons; reorder with ↑/↓; the first step is always a Section (it names the first sub-test).
- JSON mode — edit the definition directly.
Step types
| Step | Purpose |
|---|---|
| Section | Names a sub-test in progress/reports. With Reset context it clears the conversation (a fresh sub-test); without it, it is just a marker. When "Treat LLM sessions as regimes" is on, section titles become the regime names in reports. |
| Prompt | Sends text to the model, as-is. Optional per-step generation budget (tg). |
| Context | Fills the context with an exact lorem-ipsum payload (chosen in K tokens) before the next prompt — cumulative context tests stay exact. |
| Bench | A fixed-shape run: ONE request with depth corpus tokens + pp measured prompt tokens, generating tg tokens. exact-tg forces the full generation (no early stop). Independent of history. |
| Image | A vision request: pick one of the embedded test images (dropdown lists them by size) and write the prompt (default: "Please describe this image."). The image is sent to the model; the turn streams and records like any other. If the model rejects the image (no vision support, provider error), the test stops and shows the error. |
Test-level settings: temperature and max output tokens — applied to every step unless a step overrides them. Several built-ins demonstrate both.

The builder header: title, favourite mark, description, temperature and max-output overrides, the "treat LLM sessions as regimes" switch, and the Builder/JSON mode toggle.

A step card in the builder — here a Prompt step with its reorder and remove controls.

The five step types, as the builder's add-row: Section, Prompt, Context, Bench, Image.
- Run — executes the test as a single-stream conversation, live on the Chat screen (this is the "manual" mode: realistic timing, one request at a time, full history replay between steps).
- The ⚡ Runner executes the same tests under concurrent load — see next section.
Adding your own images to the vision dropdown: drop files into
assets/test_images/and rebuild — images are embedded in the binary at compile time (see Building).
Runner — concurrent load
The Runner (⚡) executes a test with N workers in parallel, all walking the same plan with a step barrier: every worker finishes step k before any worker starts step k+1, so the report stays phase-aligned.
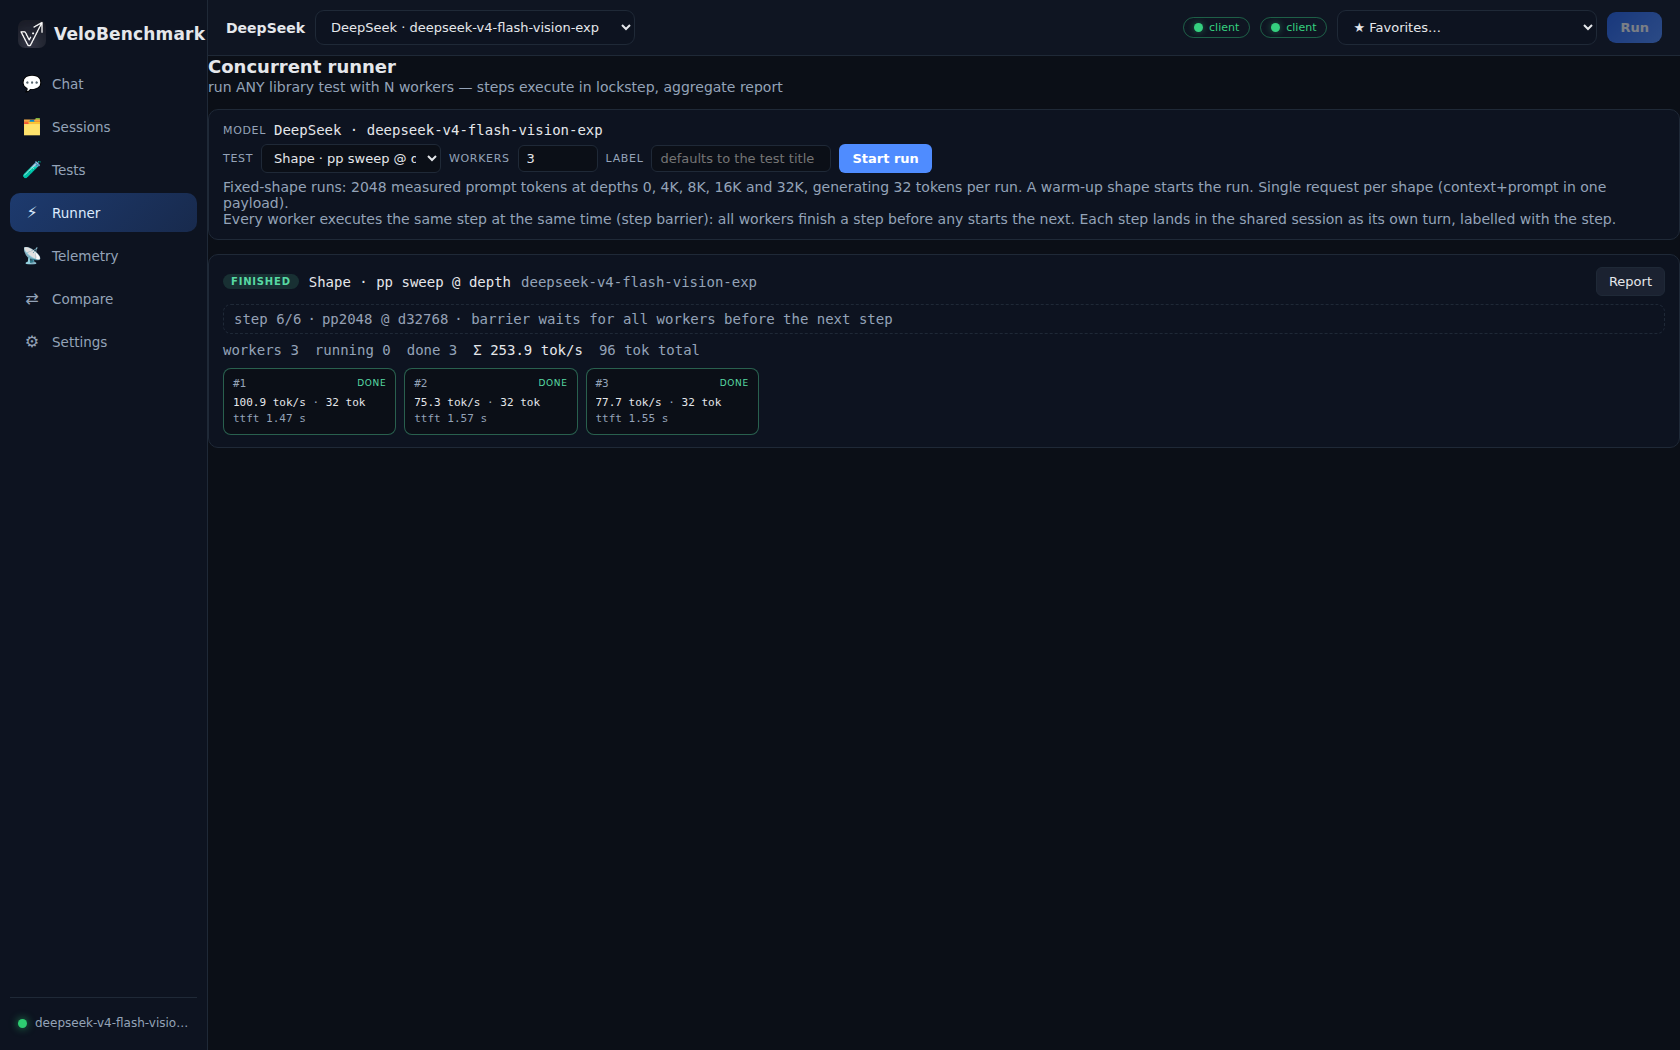
- Pick the provider + model and the test (defaults to the quick shape check).
- Set the worker count and start. Each step shows: - the current step title and progress bar, - one snapshot per worker — state (queued / starting / streaming / done / failed), tok/s, TTFT, completion tokens, - per-step failures, with the reason.
- Stop aborts the run; completed turns are kept.
- All turns land in one VeloBenchmark session, so the normal reports apply — the analytics view adds a Decode Rate Timeline — Requests + Σ section showing each request's decode rate and their sum (your effective concurrency throughput).

Per-worker snapshot cards at the end of a 3-worker run: state, tok/s, completion tokens and TTFT per worker, with the summed Σ rate in the run header.
Demo: a concurrent run from start to shared report — workers behind the step barrier, live snapshots, and the workers + Σ timeline in the analytics view. 5. Vision steps under load: if a provider errors on an image, the whole test stops immediately and the reason shows in the banner — no half-finished ambiguity about which shapes ran.
Sessions
The Sessions page (🗂) lists every recorded VeloBenchmark session — chat conversations, test runs, concurrent runs — with their turn counts and model labels. Open one to jump into its analytics; sessions can be renamed, favourited and deleted here.
Session analytics — what each report shows
The analytics view is the full report for one session. Every figure on it — rates, percentiles, clusters, acceptance, findings and the text report — is computed by the server; the browser only draws it. (That is also why the text report's Created line is UTC: the server formats it, not your browser.)
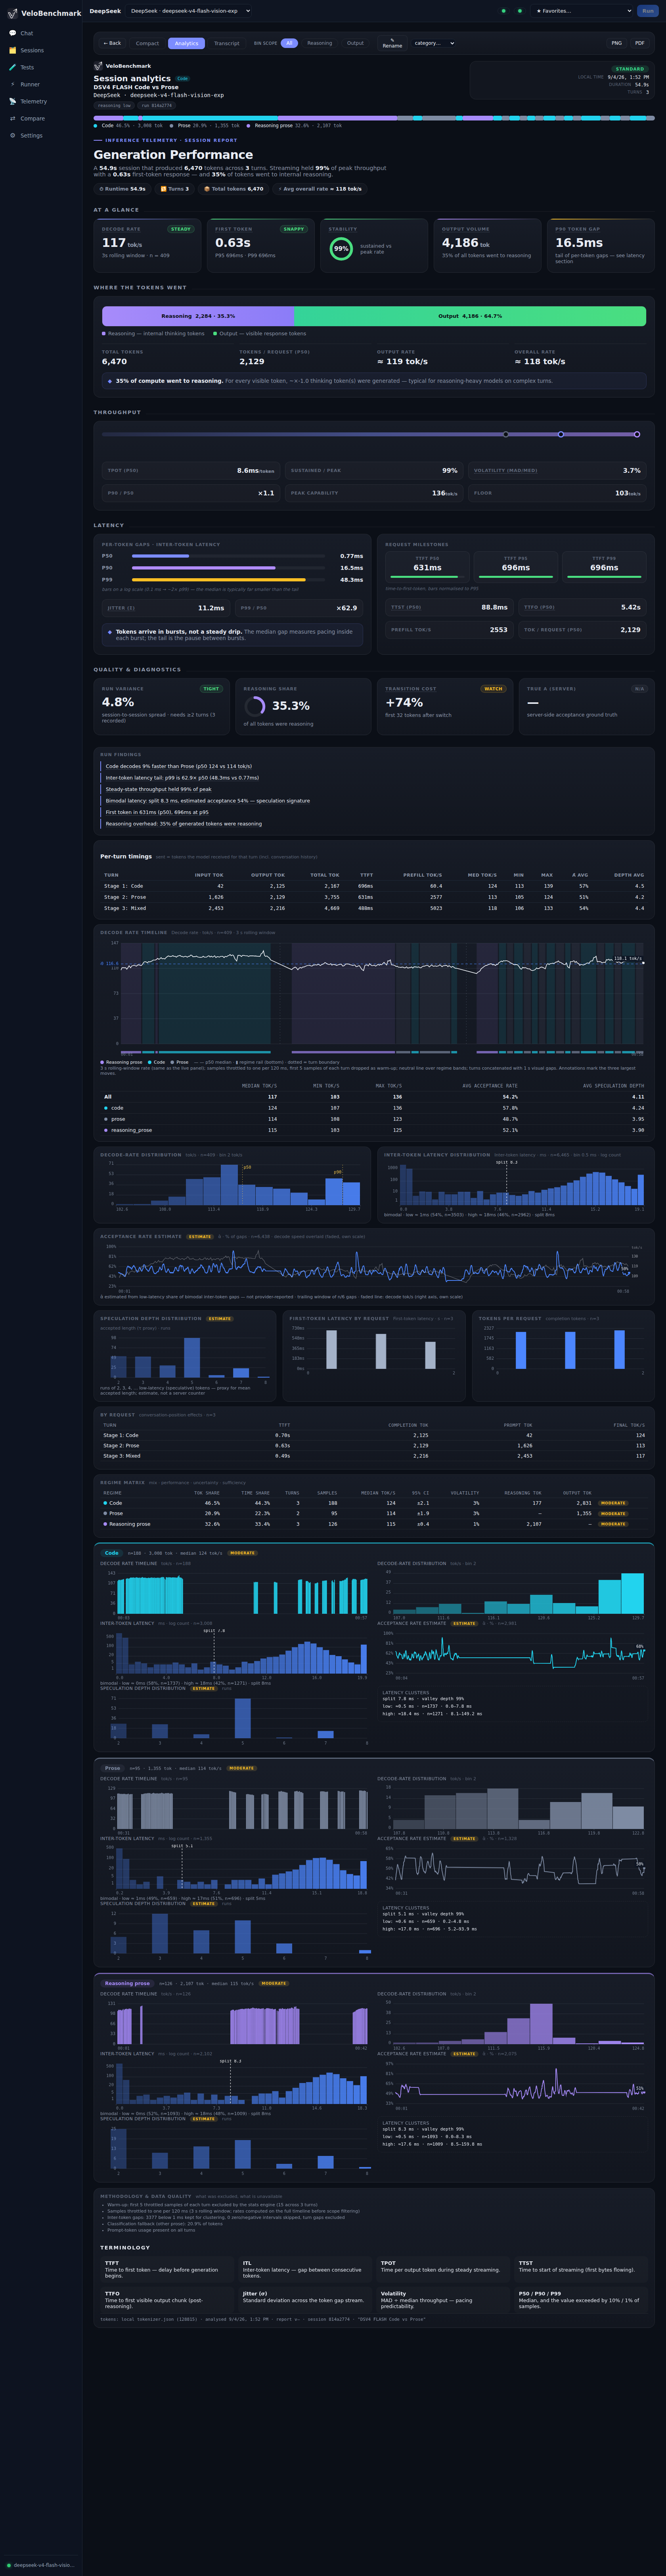
- At a Glance — the headline numbers: total tokens, wall time, average and peak decode rate, TTFT summary, per-regime split of the output.
- Where the Tokens Went — reasoning vs output vs fill composition, and the regime breakdown of generated content.
- Throughput — decode-rate story for the session: average, min / median / max with the reference lines, per-regime rates for single-stream sessions (or the single-stream average for concurrent ones).
- Latency — TTFT per request, decode-time distribution, inter-token latency (ITL) distribution.
- Quality & Diagnostics — decode-rate distribution histogram, ITL histogram, acceptance-rate estimate and speculation-depth distribution (for speculative-decoding servers), first-token latency by request.
- Decode Rate Timeline — Requests + Σ (concurrent sessions only) — every request's decode rate plotted at its true start time plus their sum: how well the server keeps up as workers stream in parallel.
- Export — the report exports as PNG (one full-dashboard image), PDF (a real paginated document: selectable text, repeated table heads, page numbers), CSV (one row per recorded request) or JSON (the complete per-request analysis payload, for independent re-derivation). Exports never include provider credentials.
- Text tab — the same report as plain text: box-drawing tables (╭─╮ ╰─╯ style) in a fixed-width font, no charts, with a Copy button for the whole report. Every figure is identical to the graphical report.
The sections of a report, as they appear top to bottom:

At a Glance — headline cards with verdict badges (steady / snappy), stability ring and the p90 token gap.
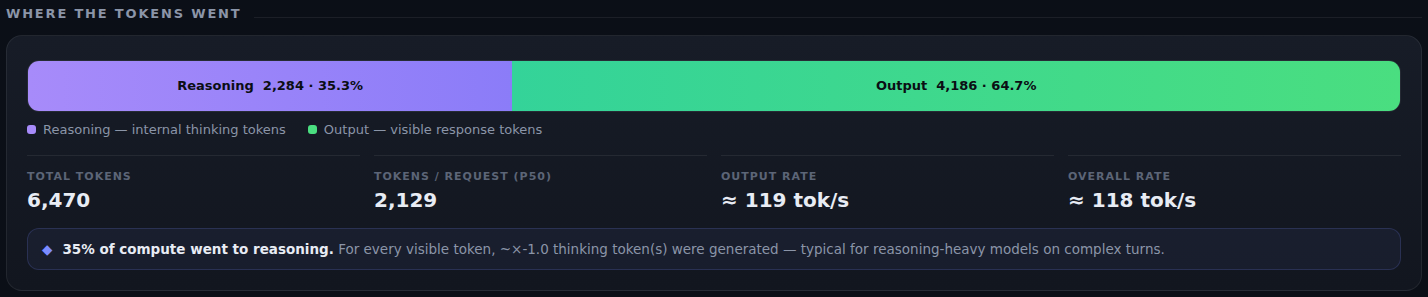
Where the Tokens Went — reasoning vs output composition with the per-request averages.

Throughput — the decode-rate story with reference lines and per-regime rates.
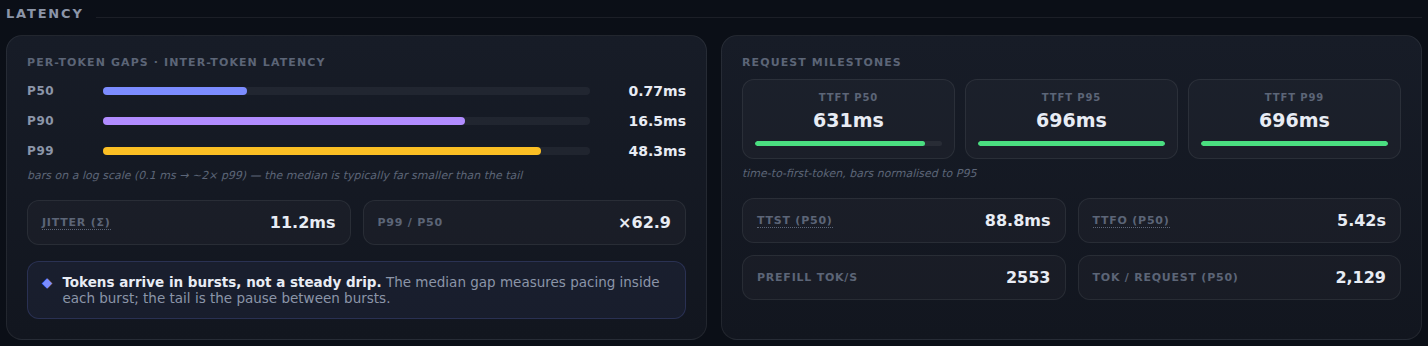
Latency — TTFT per request, decode-time and inter-token-latency distributions.

Quality & Diagnostics — decode-rate and ITL histograms, acceptance-rate estimate, speculation depth.
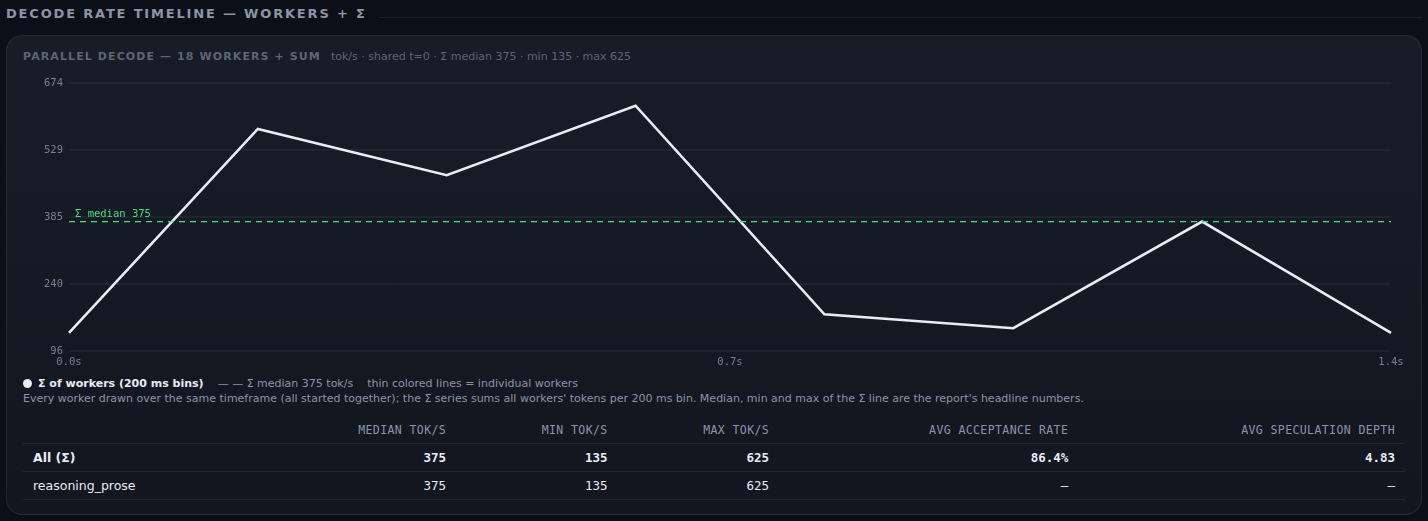
Requests + Σ — present on concurrent sessions only: every request's decode timeline and their sum.
Demo: AI-assisted regime classification — sessions tagged by their regime balance, and the per-regime decode statistics inside the report.
Comparing sessions
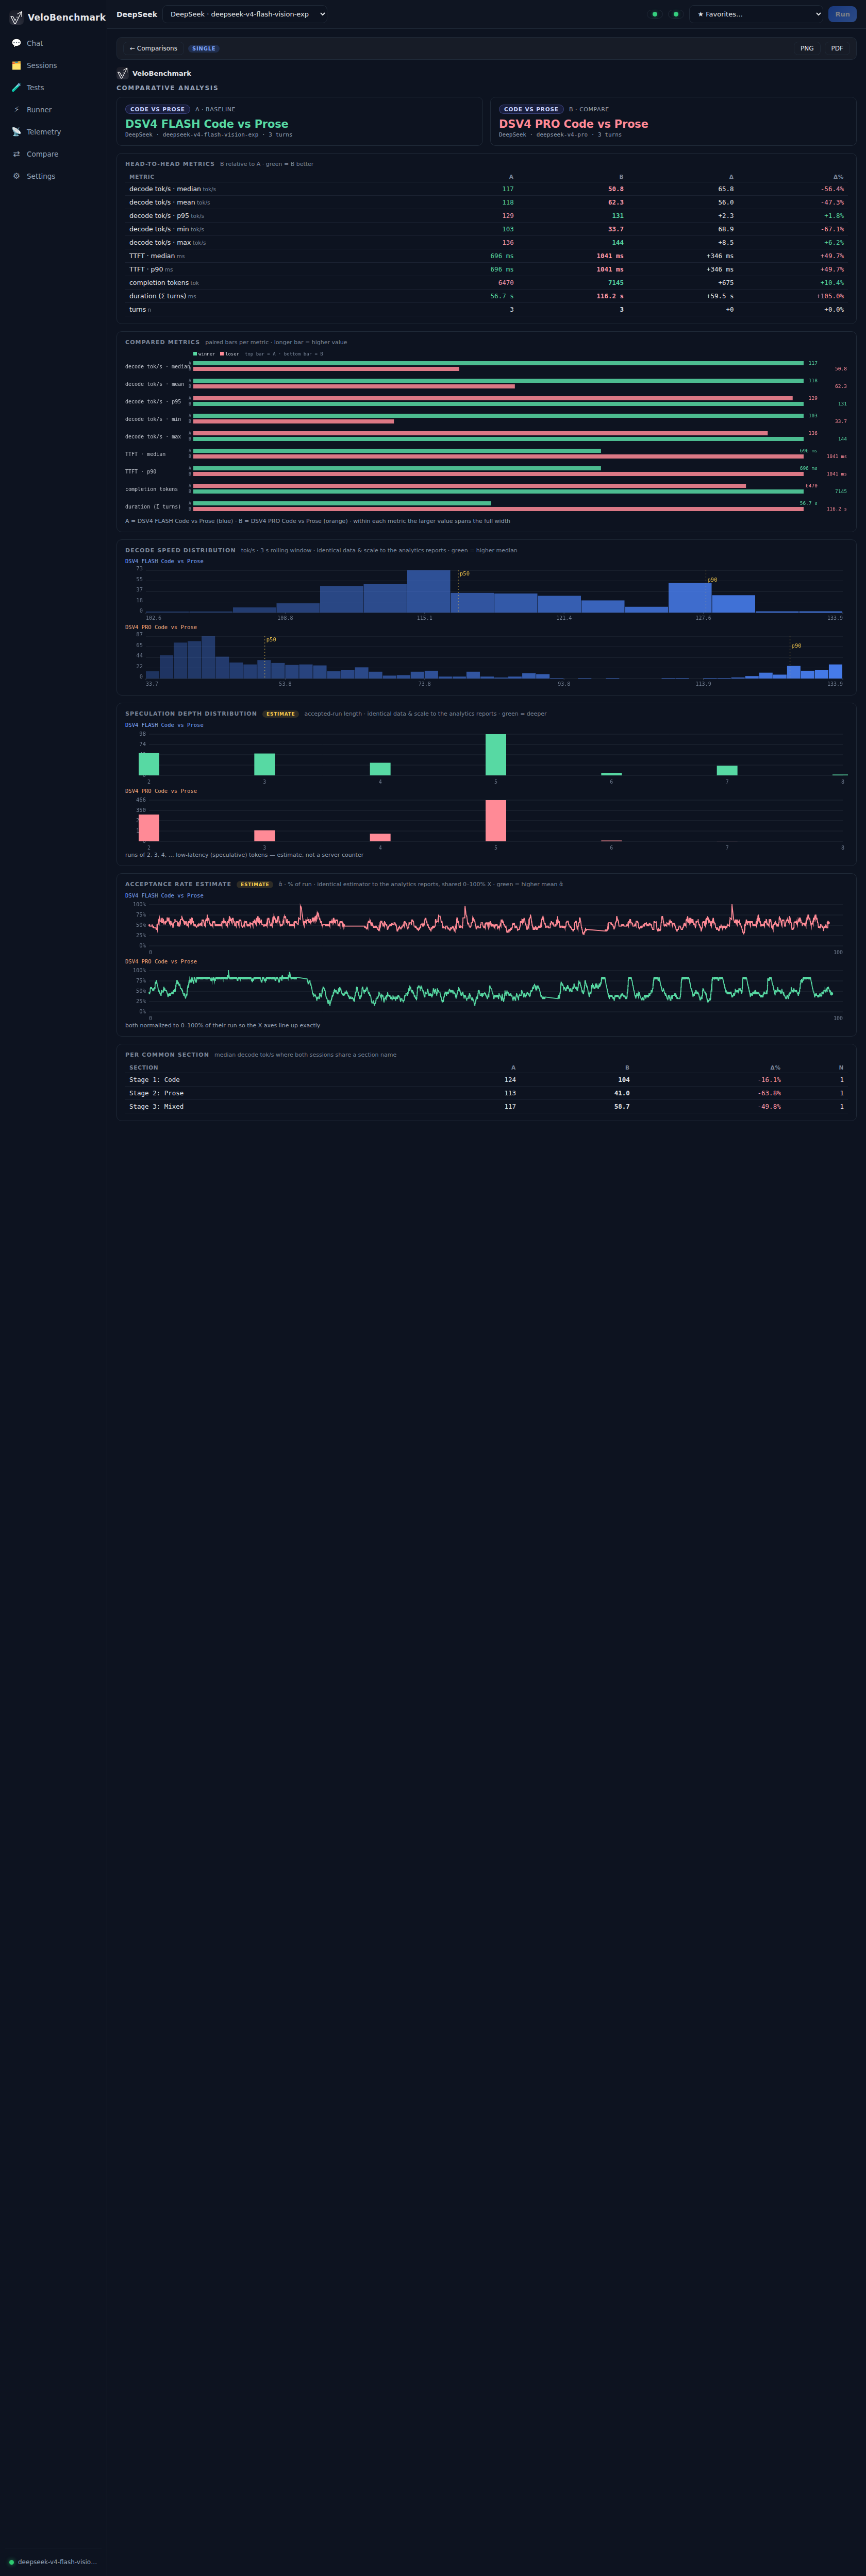
The Compare page (⇄) puts sessions side by side.
- Select two or more sessions from the list (chat runs, test runs, concurrent runs — any mix).
- Compare selected creates a persistent comparison.
- The comparison view lays the sessions' headline numbers and timelines next to each other — same prompts across models, before/after server tuning, single vs concurrent, vision vs text: whatever you line up. Head-to-head metrics carry a per-metric verdict, and incompatible pairings (different shapes, different concurrency) get a compatibility note instead of a misleading delta.
- The Text tab renders the comparison as plain text — the two sides, the metric table with its verdicts, per-common-section medians and the win/loss tally — in the same box-drawing style as the session report, with Copy for the whole thing.

The two session headers of a comparison, with regime mix and turn counts.
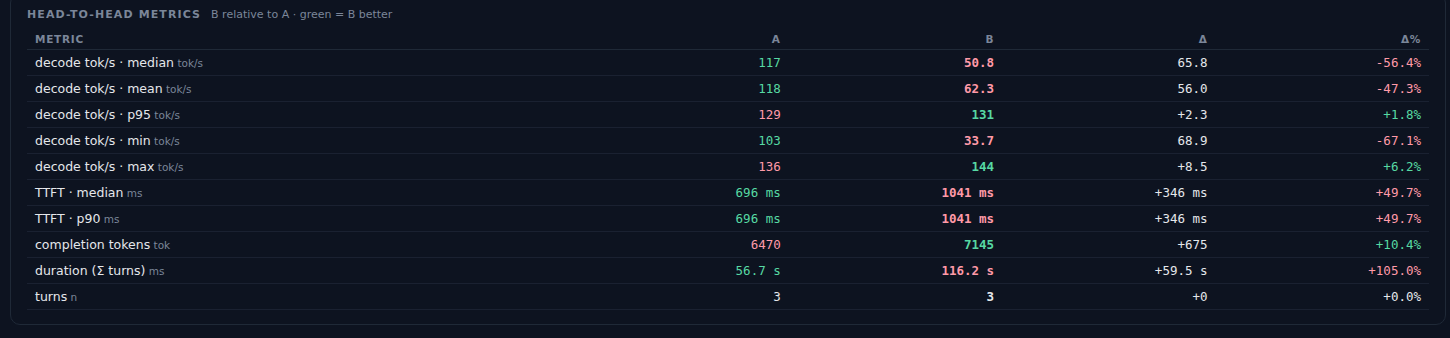
Head-to-head metrics: per-metric values for both sessions with absolute and percentage deltas, green marking the better side.
Telemetry
VeloBenchmark ships a built-in OTLP/HTTP-JSON telemetry receiver that turns a serving engine's OpenTelemetry stream into a live dashboard.
- Enable it in Settings → Telemetry (host + port;
9381is the default). - Point your engine at it — e.g.
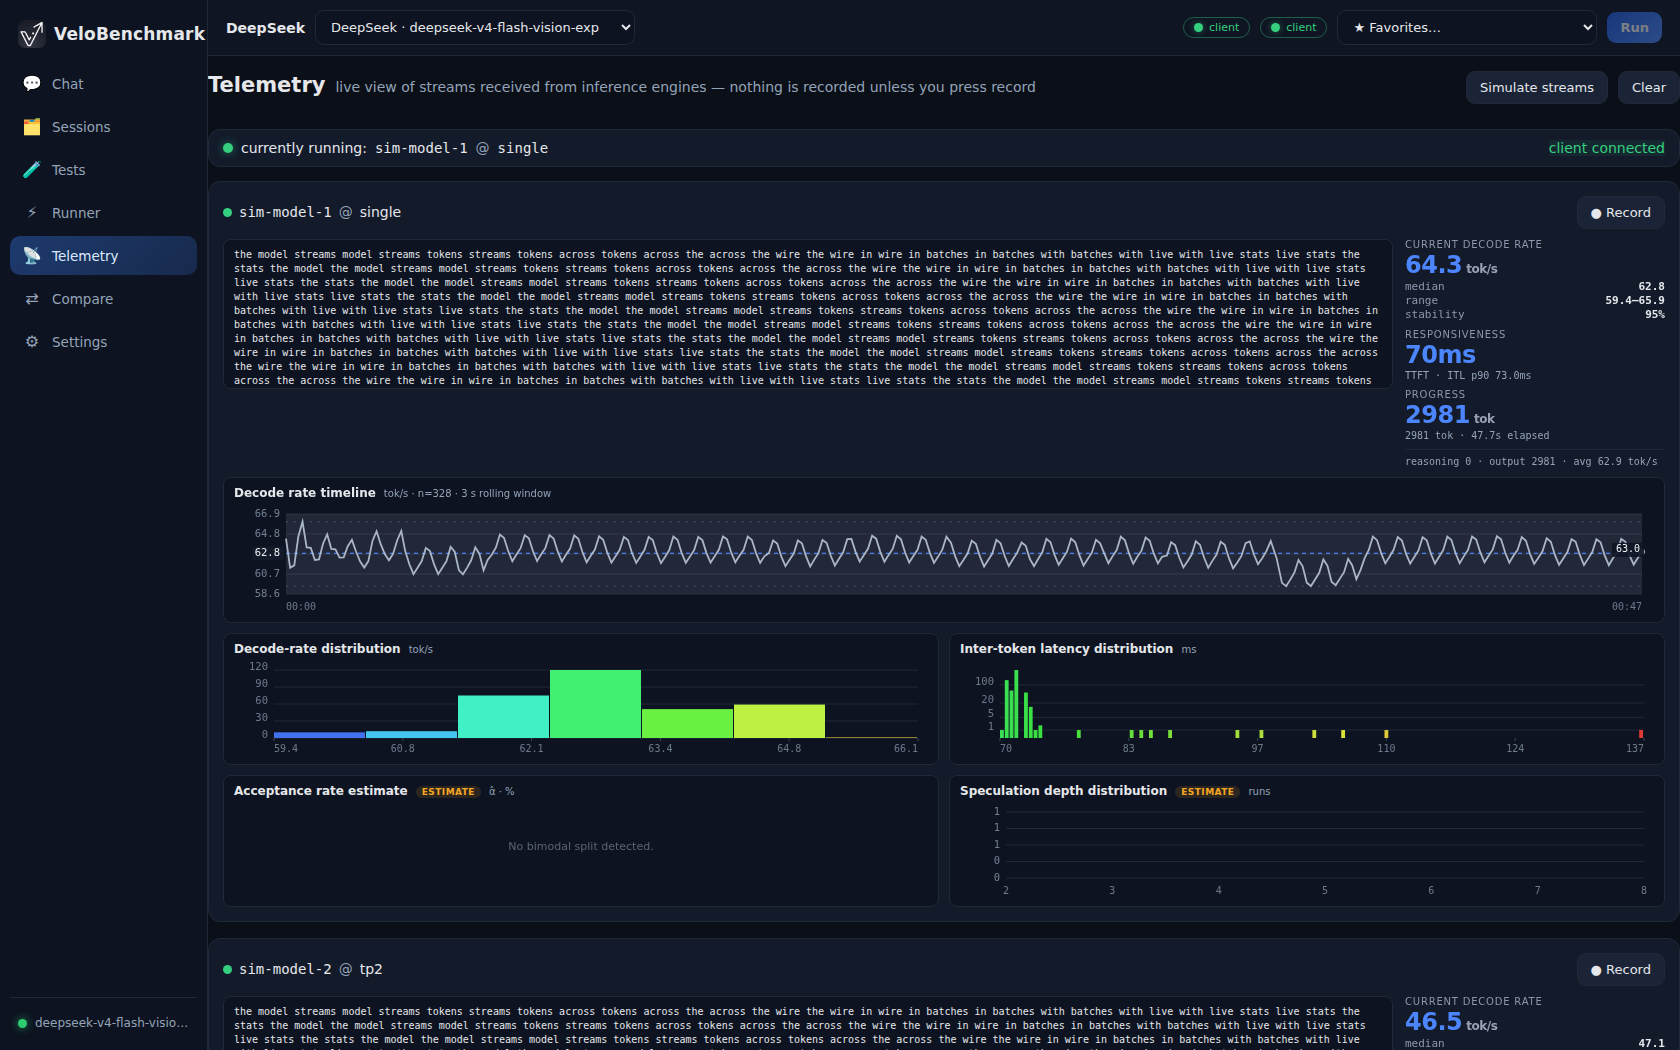
--otel-endpoint http://<velobench-host>:9381. - The Telemetry page then shows one live panel per stream: the streaming text feed, the same stats deck as the chat page, and the full chart set.
- Record captures the rolling window into a normal session (with recording caps for seconds and tokens), so a stream you caught mid-flight becomes a permanent report.
- Full setup — engine flags, batch tuning, recipes — has its own page: Telemetry setup.
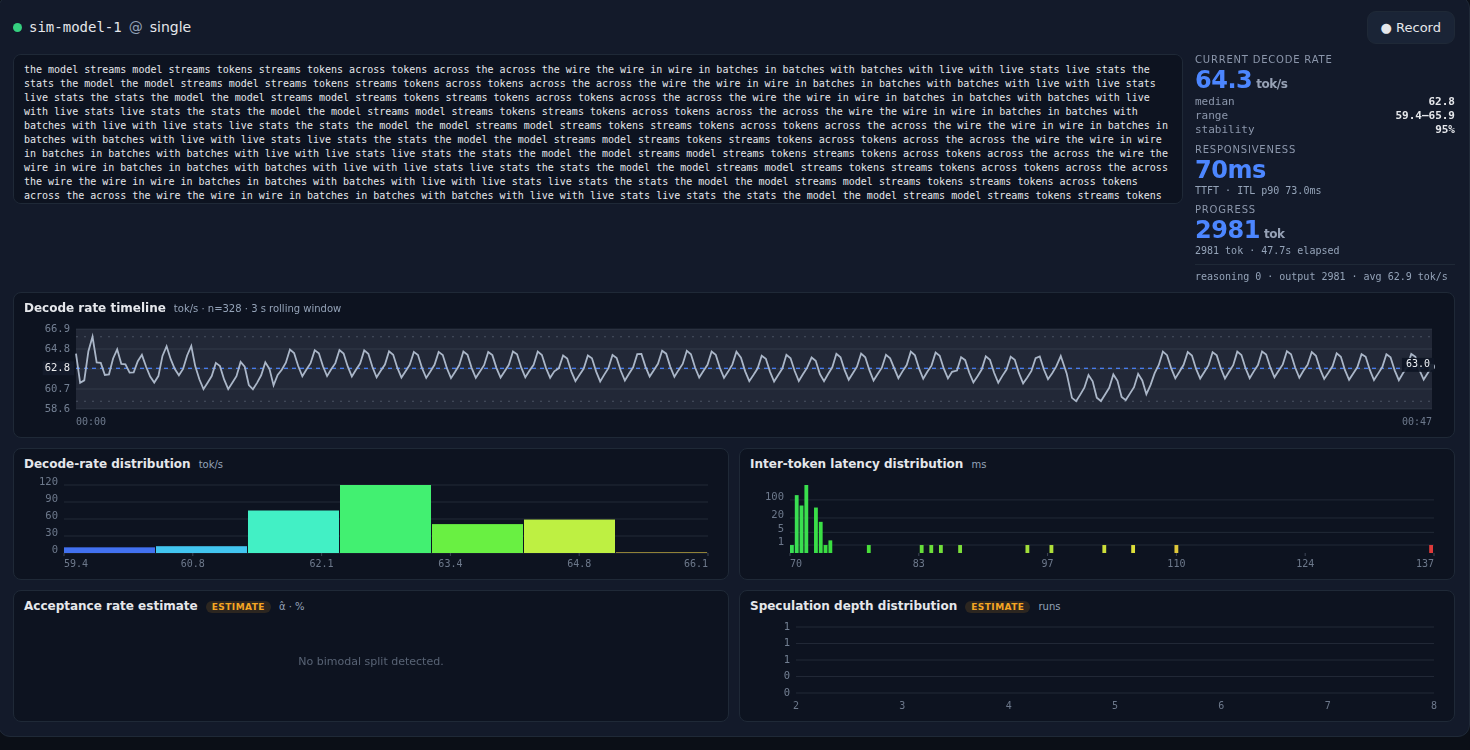
One live panel: the rolling text feed, the stats deck and the full chart set, updated ~10×/s, with Record to freeze the window into a session.
Quick start
- Build (or grab a release binary): see Building & installing.
- Start:
./target/release/velobench --host 0.0.0.0 --port 13843and openhttp://localhost:13843. - Settings → add a provider (base URL + key), add a model, pick it in the top bar.
- Chat — send a prompt and watch the live stats.
- Tests → Run a built-in suite (try Regime switch · JavaScript ⇄ story to see decode speed swing between code and prose, or Vision · all test images on a vision model).
- Sessions → open the run → export the report as PNG/PDF.
- Runner — same test, N workers, one shared report.
- Compare — line two sessions up and see what changed.